Kubeshark: Wireshark for Your Kubernetes Cluster? Find out and learn with us
TL;DR: Flying blind in your Kubernetes environment? Fight challenges of Kubernetes network observability with Kubeshark as the predator of network monitoring. Learn how this powerful tool provides real-time, protocol-level insights into your K8s cluster's API traffic, making troubleshooting a breeze and security nightmares a distant
TL;DR: Flying blind in your Kubernetes environment? Fight challenges of Kubernetes network observability with Kubeshark as the predator of network monitoring. Learn how this powerful tool provides real-time, protocol-level insights into your K8s cluster's API traffic, making troubleshooting a breeze and security nightmares a distant memory.
The Struggle is Real: Kubernetes Network Observability
Kubernetes has revolutionized how we manage our infrastructure, bringing unprecedented scalability and efficiency. But let's be real, sometimes it feels like we're navigating a labyrinth of microservices, struggling to make sense of the complex network interactions within our clusters. Traditional monitoring tools just don't cut it. We need deep visibility into the API traffic flowing through hundreds of microservices, and those old-school tools leave us feeling like we're in a "blindfolded trust fall" with our Kubernetes clusters. The lack of visibility can turn simple troubleshooting into a marathon of frustration and leave us vulnerable to security threats lurking in the shadows.
Kubeshark to the Rescue: Shining a Light on Network Traffic
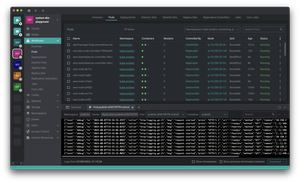
Enter Kubeshark, the Wireshark for your Kubernetes cluster! This purpose-built tool is designed to bring clarity and confidence to your Kubernetes network monitoring. Imagine having a "superpowered magnifying glass" that reveals the real-time, protocol-level details of every API call happening within your cluster. Kubeshark gives you the power to:
Visualize your network traffic: See every API call, its source and destination, and the data being exchanged, all in real-time.
Identify bottlenecks and performance issues: Quickly pinpoint performance bottlenecks and troubleshoot issues by tracing the flow of traffic through your cluster.
Improve security posture: Gain valuable insights into potential security vulnerabilities and malicious activity by analyzing the network traffic for suspicious patterns.
Kubeshark in Action: Unmasking Network Mysteries
Enough with the theory! Let's see Kubeshark in action. Imagine a scenario where your application is experiencing slow response times. You launch Kubeshark and start sniffing the network traffic. Within seconds, you see a massive spike in API calls to a specific microservice, indicating a potential bottleneck. You dive deeper into the traffic flow and discover that the service is overloaded with requests. Problem identified, solution in sight!
Kubeshark's user-friendly interface lets you:
Filter and search traffic: Easily narrow down your search to specific pods, services, or namespaces.
Analyze traffic flow: Visualize the flow of traffic through your cluster with detailed timelines and interactive graphs.
Explore protocol details: Get granular insights into the specific protocols and payloads of each API call.
Kubeshark: Your New Best Friend in the Kubernetes Jungle
Kubeshark empowers you to understand your Kubernetes network traffic like never before. It’s like having a seasoned network engineer always by your side, ready to unravel even the most complex network mysteries. No more "head-scratching" or "blindly guessing" when troubleshooting network issues. With Kubeshark, you can confidently navigate the Kubernetes jungle and keep your applications running smoothly.
Links and Resources
Don't miss your chance to experience the power of Kubeshark firsthand! Sign up for their free webinar and get a live demo of this revolutionary tool. You'll learn how to use Kubeshark to:
Unlock network visibility in Kubernetes.
Identify and resolve network performance bottlenecks.
Ya sea que necesites gestionar un millón de H100s o solo quieras asegurarte de que tu agente de IA no tire un rm -rf / en producción, las actualizaciones del Next '26 de GKE sugieren que el futuro de la IA es, inevitablemente, un archivo YAML.